
OVERVIEW
Under Pressure is the fourth installment in a series initiated by a partnership among Vantage Point, Vancouver Foundation, Victoria Foundation, City of Vancouver, United Way British Columbia and Vancity Community Foundation. In this year’s state of the sector survey, they surveyed 558 non-profit organizations across BC to check-in around various trends while also probing deeper into the underlying challenges highlighted in the last report.
The report provides consistent, high-quality data, crucial to understanding the non-profit sector in BC, and equipping funders, policy makers, and other sector stakeholders with relevant data to make informed decisions and better support the current needs of BC’s non-profit sector.
In British Columbia (BC), there are approximately 33,019 non-profit organizations, including community, business, and government non-profits. Together, they represent 360,000 jobs and contributed approximately $30 billion to BC’s economy in 2022. This same year the community non-profit sector employed 92,000 workers and contributed approximately $4.87 billion to BC’s GDP.
Focusing on the community non-profit sector specifically, this report is a snapshot of challenges and opportunities facing non-profit organizations in BC from early 2024. Non-profits are indispensable now more than ever, as British Columbians and the government increasingly depend on the sector to deliver essential services in various capacities. The sector bridges the gaps within the public support system by providing access to critical programs, activities, and supports to meet surging demand.
Section 3: Organizational characteristics.
Our findings indicate that the sector is operating in extremely difficult times, with feelings of being overwhelmed, stretched, underfunded, challenged, uncertain, and concerned. In contrast, feelings of optimism, hope, and a sense of being needed now more than ever to promote equitable and thriving communities were also expressed. As the sector continues to evolve, our report, Under Pressure, provides a snapshot of and insights into the state of the sector in British Columbia through the following two themes:
Theme 1: Less resilient times
Non-profits in BC continue to combat soaring expenses as costs rise and revenue streams remain fixed. Over the last 12 months, the sector reported all revenue sources to be decreasing, except for revenue from government sources, which has remained stable. This year also revealed increasing expenses on salaries and benefits, programs, services and activities, and general administration, as opposed to 2023 Safety Net findings, when the sector reported more stability. Non-profits are incurring significantly higher expenses on insurance, supplies, utilities, employee benefits, technology, and other essential items, which has resulted in reduced funding available for programming. Moreover, the sector survey also revealed the impact of rising inflation and climate change on operating costs. As charitable donations decline across the country, and most notably in rural communities in BC, there is immense pressure on non-profits to reduce programming, diversify funding sources, or close their doors. Nearly 50 percent of our survey respondents reported being aware of at least one to five non-profits that had closed their doors in the previous 12 months.
Theme 2: Overburdened
Our findings reveal that the non-profit sector in BC is grappling with skyrocketing demand for services and supports from clients and communities, while its capacity to deliver programs and services has remained the same. Additionally, volunteerism, crucial to the sustainability of non-profits has not recovered from pre-COVID-19 levels within the sector. Our survey sought to understand the reasons behind the increasing demand, which include population growth, inflation, and concerns around mental health, food security, housing, healthcare, climate change and the impact of the pandemic. In responding to community needs, the sector has become overburdened, as evidenced by staff burnout, high staff turnover, and the necessity to offer higher wages and salaries to retain staff, often stretching available funding.
While considering the successes, pressures, and challenges the sector reports experiencing this year, we have made the following recommendations to all levels of government, funders, and sector stakeholders and partners. We hope that collaboratively, we can move forward to address:
- Sustainability of the sector workforce through: • Establishment of a collaborative working group that includes representatives from the sector, government agencies, funders, and other key sector stakeholders to create a non-profit labour force strategy.
- Funding reforms, specifically asking funders to: • Implement a flexible administrative fee of up to 30 percent, empowering grant recipients to determine the specific percentage required. • Offer multi-year funding agreements that are embedded with inflationary increases. • Establish a formal funders collaborative to advocate for and implement funding reforms, share trust-based practices, and collectively address the funding challenges within BC’s non-profit sector.
- Nurturing a collaborative ecosystem within BC’s non-profit sector that: • Facilitates Cross-Sector Partnerships • Establishes Information-Sharing Platforms • Coordinates Training and Development • Aligns Data Collection Efforts
Section 4: Deep dive into underlying challenges identified in the Safety Net report.

istock/ MrandMrsTravel
In-Depth Data Insights: 2024 State of BC’s Non-Profit Sector
Theme 1: Less Resilient Times
Through two previous State of the Sector Surveys, our findings have revealed that non-profits are combating soaring expenses and costs that are outpacing revenues. In 2024, decreasing trends have been observed across most revenue sources, including earned income, individual donations, membership fees, special events, and corporate contributions. Revenue from government sources has remained stable for 34 percent of respondents and has decreased for nearly 27 percent.
These findings align with the decreasing trend in overall charitable donations across Canada. Data collected a decade ago shows that 82 percent of Canadians contributed to a charitable organization, but according to a recent CanadaHelps donor and climate survey, that figure has dropped to 60 percent in 2023.
Inflation is one of the major underlying factors behind increasing costs for non-profits. Recently, the Charity Insights Canada Project highlighted a persistent trend where salaries are consistently the most impacted by inflation rates – 60 percent of organizations reported impacts in 2023. This number increased to 69 percent in 2024. Non-profits are spending significantly more on wages and employee benefits, but also on insurance, supplies, utilities, technology, etc., all leading to reduced funds available for programming.
Understandably, the donation pool is also impacted by inflation as people’s willingness to donate is often correlated with their income. Since consumers feel the decrease in their purchasing power, they are less likely to donate, resulting in reduced overall funding.
As the cost of living rises, the situation is further aggravated with funding not being indexed to inflation. Close to 80 percent of organizations serving urban areas have reported spending more on salaries and benefits for staff in the last 12 months. Efforts to retain staff in the sector “…have led to much higher salaries and benefits that have not coincided with increases in funding – meaning that original project budgets need to be stretched further [and] program budgets written 2-3 years ago are irrelevant now.” Consequently, multi-year funding contributions that have not accounted for inflationary pressures are diminishing in value over time.
As a result, the sector continues to struggle with numerous constraints. With a shrinking donation pool and an increasing number of organizations competing for donations, the sector has become increasingly competitive for donor dollars. In the words of one survey respondent, “… there is significantly more demand on foundation grants, making it challenging for us to be successful on all our applications due to the volume of applications received by foundations”.
This creates increased pressure on non-profits to reduce programming, diversify funding sources, or close their doors.
Every organization has operating costs to meet, including rent or debt financing for physical premises, maintenance and repairs, office supplies, administration, insurance, accounting, marketing, utilities, salaries, and information technology such as equipment, software, internet services, and IT security. The sector struggles to update outdated technology, which takes staff time away from primary duties. Less efficient use of staff time can impact the delivery of service contracts, impede opportunities for employee upskilling, and lead to high rates of staff burnout and turnover. Non-profits also find it difficult to invest in board development and strategic planning, and to increase capacity in other ways that allows for the sustainable delivery and improvement of programs.
With the increasing number of extreme climate events such as floods, droughts, heat waves and forest fires, respondents indicated increasing operating costs to match. Nearly 21 percent of respondents revealed spending increasing amounts of resources on addressing climate change impacts on their organization and/or the communities they serve. A few examples include increasing expenses on food, snow removal, repairs to damaged infrastructure, and electricity for heating and cooling of office and programming spaces.
The sector faces numerous challenges with its relationship to funders. The current funding landscape lacks much needed flexibility in allowing non-profits to allocate resources to core costs associated with delivering services and supports to the community. As a result, the sector is often left to fend for itself to cover crucial overheads, and upon its failure to do so, the communities in need experience decreased services.
Extensive reporting to funders places administrative demand on non-profits, and our survey found that time spent reporting to both government and non-government funders is increasing for 54 percent of organizations. This is in addition to submitting grant proposals or other funding applications. Without the ability to allocate a percentage of donor and funder contributions to administration, fundraising, governance, and other essential operational expenses, most charities would struggle to sustain their operations effectively. Alarmingly, about 50 percent of our survey respondents reported to be aware of at least one to five non-profit(s) that have closed their doors in the previous 12 months.
Finally, short funding cycles are another challenge for non-profits. As government contracts are often only one year in duration, the sector experiences the “… stress of not knowing if we will get funding each year to keep our contract workers [and] to keep up with the demands of our clients.” For the sector, it implies that organizations suffer from uncertainty and are unable to offer long-term staff positions or engage in effective operational planning.
A. Revenue Trends
On average, 35 percent of respondents reported that their overall revenues stayed the same over the last 12 months. This finding aligns with last year, as only revenue from government sources has stayed about the same whereas revenue from earned income, foundations, membership fees, special events, and corporations/businesses have been decreasing. Data could also indicate that stability of overall revenues may be reflective of stability in revenue from government sources which is a primary revenue source for 41 percent of respondents.
Further, revenue from individual donations ranges between decreasing to staying about the same. In comparison to the Safety Net findings, revenue from individual donations in the last 12 months.
B. Expense Trends
A whopping 84 percent of respondents reported that their overall expenses have been increasing over the last 12 months, which indicates that organizations in the sector are struggling with reduced or stable funding as costs to operate are rising. Moreover, 80 percent of organizations also reported increasing expenses from pre-COVID-19 until now (see Graph 3).
In the Safety Net Report, expenses on salaries and benefits, programs, services, and activities and general administration ranged between staying the same to increasing which is contrary to this year’s findings where respondents have indicated an increasing trend only. Nearly 75 percent of respondents this year reported an increase in spending on salaries and benefits, 66 percent reported an increase in spending on programs, services, and activities and 68 percent of respondents indicated increased spending on general administration.
Other summary trends have indicated expenses have stabilized this year for office space, programming space, investments in diversity, equity, inclusion, belonging, and accessibility and in decolonization and reconciliation. In the Safety Net report, these ranged between staying about the same to increasing.
C. Central Operations Trends
In terms of central operations, respondents reported having about the same amount of capacity to operate (i.e., physical space, resources spent on marketing and communications, conducting internal meetings, and procuring supply and services), even as demand for services and support from community is increasing overall.
Similar to our findings from 2021 and 2023, 59 percent of organizations reported spending increasing amounts of time and/or money on information technology and 34 percent reported spending about the same amount in the last 12 months. Another 54 percent indicated they are spending increasing amounts of time reporting to funders, governments etc. about their activities. Clearly, “…government red tape is a major part of the problem and compliance is time consuming.”
Theme Two: Overburdened
British Columbians depend on non-profits more than ever to access a variety of services, programs, and supports. The non-profit sector service usage and demand is at an all-time high, with two in ten Canadians using charitable services to meet essential needs in 2023, according to an Ipsos survey commissioned by CanadaHelps. In a December 2023 public opinion poll commissioned by Imagine Canada and BMO, 17 percent of respondents indicated that they had personally engaged the services of a charity or non-profit to soften the impact associated with inflation and a higher cost of living.
This has nearly doubled from 9 percent a year earlier. However, most charities are unable to meet current levels of demand. Clearly, the sector is experiencing a mismatch between community needs and the capacity to meet those needs.
In alignment with this data, we heard similar concerns from the non-profit sector in BC. Nearly 76 percent of survey respondents reported experiencing increasing demand for services and supports from clients and communities, while their capacity to respond to the demand has stayed about the same for 39 percent of respondents and decreased for 31 percent. In comparing trends from our Safety Net findings, we saw no variation in this parameter, which indicates that the sector continues to deplete itself to keep pace with increasing demands. It is imperative to pause and consider that while BC’s non-profits appear to be stable in capacity, the sector is stretched to its limits.
So why are the sector’s demands for services and supports on the rise?
Firstly, from our survey, we heard that there is an increasing need to serve community members as “… population has grown exponentially, and infrastructure has not kept up, the need for our services continues to grow as people in general are under greater stresses and are experiencing mental health crises.” The sector also reported struggling with increased demand for food banks, low-cost housing, literacy services, supports to newcomers and refugees, shelters for people facing homelessness, support for mental health, and medical and clinical support.
Secondly, climate change has acted as a catalyst in increasing demand pressures on the sector as well. Due to extreme weather events, there has been an increase in need for supports and services, from cooling and heating centres to emergency spaces such as evacuation centres, necessitating emergency plans and increased response and preparedness from non-profits in the sector.
Thirdly, inflation is a persistent factor that has increased financial pressure on people with low incomes as well as families, which in turn increases demand for low-cost services provided by non-profits. There is ongoing response to community needs from the sector, wherein “… we currently subsidize many of our programs because that is what our market can fare. We cannot increase our fees because many of our stakeholders cannot afford to participate if there is no subsidy.”
Lastly, with mental health concerns, food insecurity, social isolation, and homelessness on the rise, the impact of the COVID-19 pandemic is still being felt within the sector. Approximately 57 percent of respondents indicated an increase in their delivery of programs, services, and activities as compared to pre-COVID-19 times.
With the rising demand for services, non-profits face the dual challenge of meeting community needs while striving to be sustainable amidst challenging circumstances. Coping with heavy workloads, staff turnover, under-staffed teams, restricted budgets, and an inability to offer competitive wages, the well-being of a non-profit is likely to be compromised with the increasing needs of communities.
While employment within a non-profit is often fulfilling, there is a high risk of burnout and negative mental health impacts due to the nature of the work and increasing workloads. The sector reports that “… increased demand for services has taxed our volunteers and staff.”
Increased demands also lead to staff burnout and turnover: “… unprecedented and constant hiring/training is weighing heavily on the organization. We cannot pay adequately to support the workforce and people leave. The nature of work is also emotionally taxing, and people burn out.”
Moreover, the sector is also experiencing a changing volunteer landscape post-COVID-19. With aging volunteers, and rising burnout levels, volunteer involvement has also reduced within the sector. As a result, nearly 41 percent of respondents have indicated spending an increasing amount of time and money on recruitment and retention of volunteers. The sector has also identified significant skill gaps within its workforce, exacerbated by challenges in recruiting from a limited pool of skilled workers. In a recent Canadian Survey of Business Conditions (CSBC), only 41 percent of non-profit employers reported that their employees possess all the skills needed by the organization, compared to 63 percent of government employers and 42 percent of business employers.
Our survey respondents reported that, “… finding qualified staff is so hard right now – we have had the most difficult time finding employees and retaining them despite paying reasonable rates.”
This finding can be interpreted in two ways. Firstly, the sector consistently loses workers to government and business employers, so it is not surprising that it is hiring from a less experience, less skilled labour pool. Secondly, prevailing public perceptions about the sector such as lower wages, scarce benefits, job insecurity, and lack of opportunities for career advancement deterred skilled workers from seeking employment in the sector. Unfortunately, many of these challenges are a result of a restrictive funding environment that does not prioritize core investments in workforce upskilling and/or reskilling.
D. Program and Service Delivery Trends
On average, 50 percent of respondents reported that their overall ability to deliver on their mission has stayed about the same in the last 12 months. However, 76 percent of respondents reported increasing demand for services and support from clients and communities while capacity to deliver has been reported to be staying about the same for only 39 percent. Clearly the sector is being depleted through reduced revenues, increasing expenses, and limited capacity to meet increasing needs of the communities they serve.
E. Human Resources Trends
Overall, 68 percent of respondents reported increasing levels of wages and salaries for staff, similar to our finding last year. This trend reflects the undertones of rising cost of living and burnout among staff and volunteers, which organizations in the sector attempt to address by increasing wages and salaries with limited funding from which to draw from. Clearly, the inability to offer a competitive and/or living wage often results in significant staff turnover in a sector that is trying to keep up with increasing demand for its services.
While 41 percent of respondents reported stable volunteer involvement, another 29 percent indicated decreasing levels, which reflects the changing volunteer landscape being experienced by the sector. In terms of benefits offered to staff, overall, 47 percent of organizations reported offering the same level of benefits while overall revenues remained, on average, the same. Respondents also reported that the number of full-time staff, parttime, temporary, contract, and seasonal staff stayed about the same in the last 12 months.
This demonstrates that reduced funding restricts the sector in hiring more staff even as demand for services is on the rise. Often charities and non-profits also manage underfunding by reconfiguring staffing levels as this is one of the few areas where the budgets are flexible. This is done by laying off core staff or hiring staff on contract so their employment can be terminated when funding ends or during a funding gap.
F. Governance Trends
It appears that there is some stabilization happening around people in leadership roles reflecting the communities they serve, resources spent on governance structure or board processes, and strategic/scenario planning. However, our data also tells us that 56 percent of respondents reported increasing amounts of resources being spent on strategic/scenario planning and 35 percent reported the amounts to be stable. Compared to Safety Net findings, respondents reported spending same amount of resources in the last 12 months on managing conflict, crisis management and building relationships among or between the board and executive director.
Disaggregated Analysis.
Trends across rural vs. urban-serving organizations, subsectors, and demographic groups served.
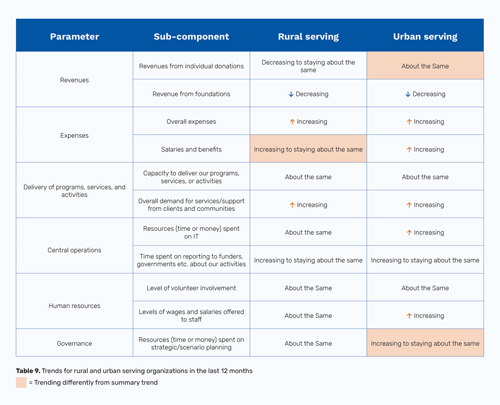
Rural vs Urban Trends
When comparing rural versus urban respondents, we find that trends differ in all but one parameter: delivery of programs, services, and activities (see Table 9). 36 percent of organizations in urban areas reported stable revenues from individual donations as compared to organizations serving rural areas, which reported donations to be decreasing to staying about the same. In comparison to the Safety Net findings, however, this revenue source has become more stable for rural serving organizations in the last year. While overall expenses, expenses on programs, services and activities, and general administration are rising for both, organizations serving urban areas reported increasing expenses on salaries and benefits, as compared to organizations serving rural communities.
Again, in comparison to Safety Net’s findings, this trend has shifted from being stable to ranging between stable and increasing for organizations serving rural communities, reflecting the impact of rising cost of living now reaching smaller communities in the last 12 months. In terms of operations and governance, nearly 54 percent to 59 percent of organizations serving urban areas reported increasing amounts of resources being spent on information technology and strategic/scenario planning, as compared to organizations serving rural areas.
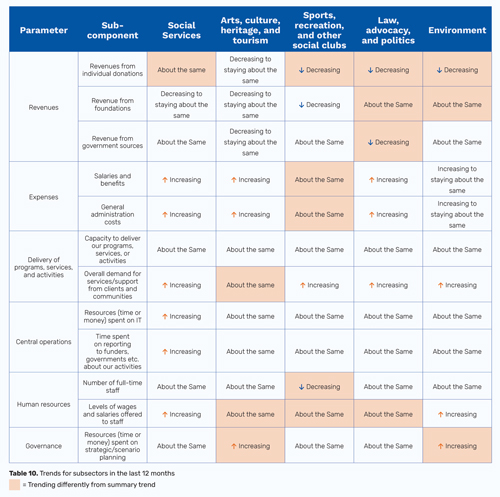
Subsector Trends
The following trends within specific subsectors emerged prominently during our disaggregated data analysis:
- Social services – Organizations belonging to social services reported stable revenues specifically from foundations and government sources. While revenues remain stagnant, 82 percent of respondents within the subsector reported increasing expenses on salaries and benefits, and 66 percent reported spending increasing amounts of time and money on information technology. A total of 194 organizations reported to belong to the social services subsector.
- Arts, culture, heritage, and tourism – Contrary to the summary trends, nearly 51 percent of organizations belonging to the arts, culture, heritage, and tourism subsector reported decreasing revenue from government sources, and 39 percent reported stable revenues from foundations. 35 percent of this subsector also reported stable overall demand for services and supports from the clients and communities they serve, while salaries and benefits rose. In terms of governance, 63 percent of the sector reported spending increasing resources on strategic/scenario planning.
- Sports, recreation, and other social clubs – Of all the subsectors, 13 percent of organizations belonging to the sports, recreation, and other social clubs subsector reported a decreasing trend in the number of full-time staff hired, which may be associated with the fact that 21 percent of the subsector reported spending the same amount on salaries and benefits, as well as general administration costs (33 percent), in the previous 12 months.
- Law, advocacy, and politics – While the summary trend for overall revenues remains stable, 55 percent of organizations belonging to this subsector notably reported decreasing overall revenues, as expenses on salaries and benefits increased for 82 percent of respondents. Moreover, 64 percent of respondents revealed decreasing revenues from individual donations, as well as from government sources (36 percent).
- Environment – Particularly for organizations within the environment subsector, 60 percent to 67 percent reported spending increasing amount of time and/or money on marketing and communications, conducting central operations, reporting to funders, governments, and strategic/scenario planning.
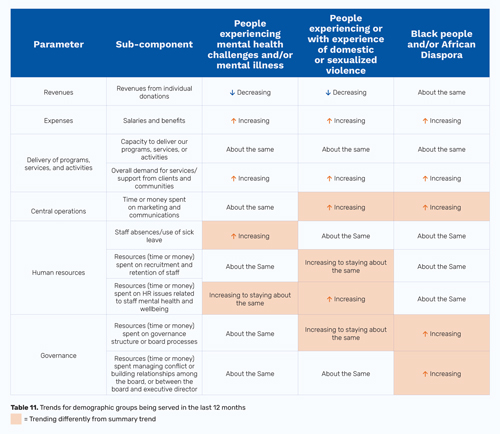
Demographic Group Trends
Demographic groups most served by respondents—such as adults, seniors, youth, children, families, and people experiencing poverty or with low income—are experiencing overall trends that align with the summary trends of stable revenues, increasing expenses, and soaring demand for services and support. In the remainder, organizations serving the following demographic groups in particular have stood out:
- People experiencing mental health challenges and/or mental illness – Organizations serving this demographic trended differently for issues related to recruitment and retention than organizations focusing on other demographics. Nearly 83 percent of organizations serving this demographic group indicated an increase in the level of wages and salaries offered to staff, despite with individual donations decreasing. 52 percent to 67 percent reported an increase in staff absences, time and/or money spent on recruitment and retention of staff, and HR issues related to staff mental health and wellbeing.
- People experiencing or with experience of domestic or sexualized violence – Despite challenges with human resources, nearly 82 percent of respondents serving this demographic group indicated an increase in the level of wages and salaries offered to staff, and 55 percent to 73 percent reported increasing amounts of resources being spent on recruitment and retention of staff and the development of HR-related policies.
Increasing expenses on office space, programming space and investments in decolonization and reconciliation were also reported by respondents, ranging between 68 percent and 82 percent.
- Black people and/or African Diaspora – With increasing wages and salaries, organizations serving this demographic group have reported some unique trends from other groups. For 58 percent to 67 percent of respondents, increasing resources were spent on governance such as governance structure or board processes, strategic/scenario planning, and managing conflict or building relationships with other organizations. Overall, the survey found that time or money spent on marketing and communications stayed about the same for the non-profit sector. However, organizations serving Black people and/or African diaspora (75 percent), newcomers, immigrants, or refugees (69 percent), and people with experience of (or experiencing) sex work (67 percent), and chronic illness or a long-term condition (72 percent) reported spending increased time or money on marketing and communication.
Recommendations
While British Columbia’s non-profits operate in a time of uncertainty, the sector continues to be the heart of our communities, and support for this sector is essential. Recently, the Province of BC recognized the non-profit sector as an important partner in its delivery of key community services, through the declaration of a BC Non-Profit Day, the initiation of the Recovery and Resiliency Fund, and investments into ongoing programs and services. With this increasing recognition comes a curiosity to better understand the emerging needs of the sector.
In this year’s State of the Sector Survey, we asked organizations to consider the successes and challenges they have experienced so far, and to highlight resources, information, or support they may need from all levels of government. The responses received were aligned with this year’s emergent trends and condensed into priorities for the sector. Our recommendations from the data include:
Sustainable Sector Workforce
The sector grapples with complex decision-making regarding compensation and optimal use of revenue to deliver services, activities, and support. Operating against a backdrop of escalating costs, expenses related to staff wages are steadily increasing within the sector. The inability of organizations to offer competitive wages places a financial strain on staff, leading to feelings of undervaluation and exacerbating recruitment and retention challenges.
This imbalance between cost of living and wages also detracts from the sector’s attractiveness to a talented and skilled workforce. Additionally, volunteerism, crucial to non-profits’ effective delivery of services and programs, has not recovered from pre-COVID-19 levels within the sector. Low levels of volunteer engagement across Canada have been exacerbated by aging volunteers and a shifting volunteer recruitment landscape: “Volunteers are aging out and younger generations don’t seem to hold the same commitment to volunteering. After COVID volunteers seem to value their leisure time more [….] With the current cost of living many volunteers are looking for paid work!”
Developing a labour force strategy that includes a volunteer revitalization plan and reassessing funding to accommodate rising staff wages and ensure a living wage is crucial for retaining, attracting, and properly valuing the sector’s workforce, thereby ensuring its sustainability.
With support for enhanced volunteer engagement and compensation/compensation planning, the sector can offer a competitive work environment that includes flexible work arrangements, enhanced health insurance coverage, retirement savings programs or pensions, sufficient paid time off, and additionally benefits such as peer-to-peer mentoring, employee discounts, recognition programs, and educational and training opportunities.
Currently, many non-profits report losing skilled workers to other sectors and jobs offering higher pay and security: “[There needs to be] recognition of the need to pay staff market value – our biggest competitor is our funder (staff moving to government jobs for higher pay).”
The non-profit sector in British Columbia is a significant contributor to the provincial economy, generating billions of dollars in economic activity annually. Notably, its workforce is predominantly comprised of women. In response to a 17 percent gender pay gap identified by Statistics Canada in 2023, British Columbia enacted the Pay Transparency Act. While smaller non-profits in BC are exempt from submitting pay transparency reports, implementing a non-profit labour force strategy would strengthen employment for women in non-profits large and small and significantly contribute to addressing overall gender pay inequity within the province.
To create a non-profit labour force strategy and address sector workforce sustainability, we recommend the establishment of a collaborative working group that includes representatives from the sector, government agencies, funders, and other key sector stakeholders. By working together, we can create a more equitable and sustainable labour force that continues to provide vital services and programs to B British Columbians.
Funding Reforms
The Community Foundations of Canada defines trust-based philanthropy as an approach that addresses the inherent power imbalances between funders, non-profits, and the communities they serve. Trust-based philanthropic and granting practices include multi-year unrestricted funding, simplified and streamlined paperwork and reporting, funder transparency and responsiveness, timely transfer of funds, and non-monetary support. These practices can increase the responsiveness of the sector to emergent needs and enhance the efficacy and impact of services and programs.
With the sector experiencing rising overall expenses, non-profit organizations need flexible, unrestricted financial support now more than ever. In the current funding milieu, the sector struggles to cover costs associated with day-to-day operations through program or project-based funding—the percentage of administrative fees allowed from each grant varies between 5-12 percent. Additionally, grantees are often restricted from adjusting project spending as needs arise over the term of the grant. Flexibility in funding contracts can significantly alleviate these challenges. By expanding the percentage of administrative fees that non-profits can claim per grant, organizations would have greater capacity to cover essential operational expenses such as rent, utilities, salaries, and technology upgrades. Furthermore, less restrictive granting criteria or engaging grant recipients in the design of the grant call can increase the success of funded programs and projects.
Consistent with our previous recommendations, we call on all funders to implement a flexible administrative fee of up to 30 percent, empowering grant recipients to determine the specific percentage required.
Currently, short-term funding cycles have damaging consequences on the sector’s ability to offer higher wages and benefits and longer employment contracts. In soliciting grant applications, funders often seek new project proposals instead of offering multi-year funding to sustainably support existing programs that have proven efficacy.
For communities, unstable funding increases the probability that vital services and supports will not be accessible when needed. Additionally, inflation reduces the loss in real value of multi-year contributions. Our recommendation is for funders to offer multi-year funding agreements that are embedded with inflationary increases.
Trust-based funding practices and processes can mitigate the rising grant reporting administrative burden currently faced by the sector, allowing non-profits to focusing on serving their communities, exploring new funding streams, innovating solutions, and engaging in long-term planning. While it is crucial for funders to continue to learn about the needs and issues of the non-profits and communities they support, a trust-based approach to grant reporting provides equity to grant recipients and establishes a reciprocal relationship of mutual learning. There are many funders who have adopted successful trust-based practices in BC. We recommend establishing a formal funders collaborative to advocate for and implement funding reforms, share trust-based practices, and collectively address the funding challenges within BC’s non-profit sector.
In the voices of the sector:
Ecosystem of Collaboration
Despite the non-collaborative environment often engendered by funding competitions, non-profits in BC have found different ways to work together through community coalitions, roundtables, action teams, and advocacy networks to address local, regional, or sub-sector specific issues. Through our survey, we heard the need to nurture an ecosystem of collaboration and identified some opportunities for the sector to continue to work together to benefit all non-profits.
An ecosystem of collaboration for the non-profit sector must include non-profits forming partnerships across different subsectors, with diverse government ministries, funders, and the private sector. Through these partnerships, non-profits can coordinate, reduce redundancy and duplication, maximize impact, leverage relationships, provide mutual support, and optimize costs through pooling of resources and services. Administrative templates, for example, can be shared through “…a common bank of canned HR policy and templates that could be accessed by NGOs, and they can customize for their needs.” Similarly, non-profits can benefit from shared training opportunities, financial or business planning support, or access to information technology. More than one respondent spoke about burgeoning organizations leveraging the expertise of established organizations. Another aspect would be to collaborate on data collection to avoid duplication of data, improve quality of data, and enable enhanced data analysis and policy recommendations.
Recommendations for nurturing a collaborative ecosystem within BC’s non-profit sector:
- Facilitate Cross-Sector Partnerships: Support non-profits to form partnerships across different subsectors, with diverse government ministries, funders, and the private sector.
- Establish Information-Sharing Platforms: Create online platforms or hubs where non-profits can share resources, best practices, and templates.
- Coordinate Training and Development: Organize free or low-cost joint training sessions, workshops, or seminars on topics that are relevant to all non-profits.
- Align Data Collection Efforts: Support the development of common metrics, data pooling, and the standardization of data collection tools.
By implementing these recommendations, the non-profit sector in BC can enhance its collaborative efforts, ultimately leading to greater collective impact and strength.
Related Posts


